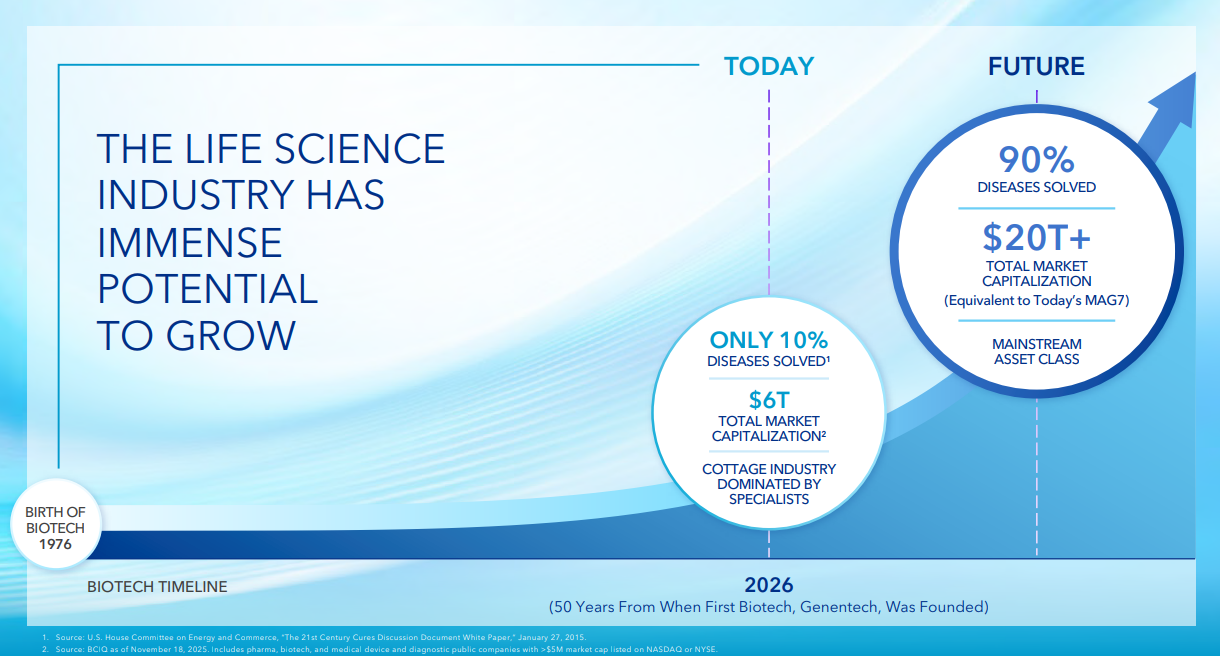
Chris Hohn’s interview with The Financial Times was sobering. He contends there are only about 200 companies in the world that are investable. These are the privileged purebreeds who can raise prices with impunity. Naturally, shares of these champions trade at massive premiums to the rest of the market. Exhibit A is Hohn’s largest holding, GE Aerospace which profits from a duopoly in the jet engine market. Sadly, trading at 38 times earnings, it’s no bargain.
When all the best companies are priced to perfection, what’s a value investor supposed to do? It reminds me of the Wall Street scene at 21 Club. Gordon Gekko instructs Bud Fox, “Cover the Bluestar buy, and put a couple hundred thou in one of those bow-wow stocks you mentioned. Pick the dog with the least fleas. And buy yourself a decent suit. You can’t come in here looking like that. Go to Morty Sills. Tell ’em I sent you.”
I know the feeling, Bud. When the pedigree canines are too expensive, you have to find a few mutts. I’m talking about finding a loyal hound, not the pug crossed with a Chihuahua. Maybe it’s a beagle that had a fling with a golden retriever. Or the Australian sheepdog who spent a spa weekend at Labrador camp. Man’s Best Friend. The kind of pooch that will fetch your slippers, carry a keg of brandy and guard your kids. Those are the mutts I’m looking for.

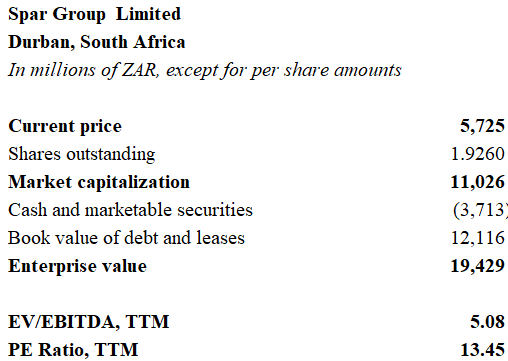
Where are the dogs with the least fleas? Well, I found a few in the South African consumer sector. One standout is Spar Group Limited, South Africa’s second leading grocer. Spar generated over $8.1 billion in sales from continuing operations during the last fiscal year ended September of 2025. Having shed its unprofitable operations in Poland, Switzerland and the UK, Spar Group has narrowed its focus to its to core markets: Southern Africa and Ireland. The company also operates a joint venture in Sri Lanka. Debt has been reduced by $250 million following the divestitures. Spar’s market capitalization of $700 million represents a 14% discount to my estimate of the company’s intrinsic value.
Spar is better understood as a wholesaler. It doesn’t actually own and operate its retail stores. Instead, each retail operator brands its location with the Spar livery and agrees to purchase its inventory from Spar. Store operators also agree to pay marketing and inventory management fees to Spar, akin to a franchise model. Spar Group is affiliated with Spar International which is based in Amsterdam, where it began business in the early 1960’s. Spar International awards country licenses to various wholesalers around the world, and Spar Group holds the licenses for Southern Africa, Ireland, and Sri Lanka. While some products on sale in a Spar are locally sourced, much of the inventory consists of “Spar” private label products.
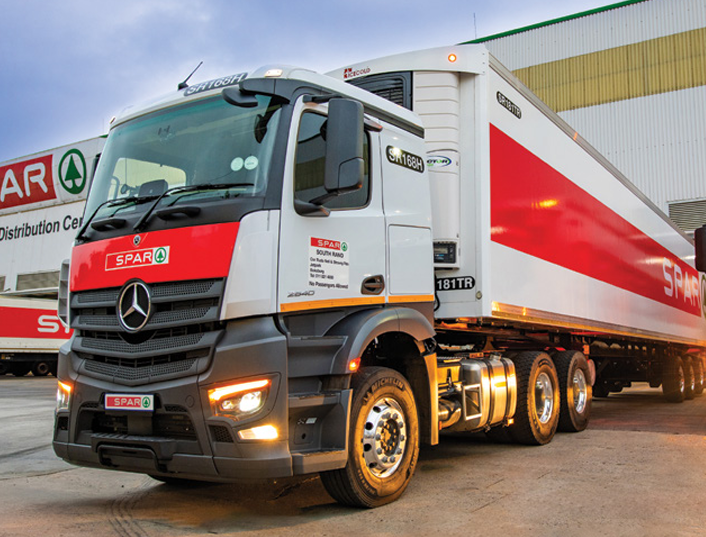
Spar Group is headquartered in Durban, South Africa where it recently moved after selling off its offices in nearby Pinetown. Spar is the second largest food retailer in South Africa. Spar stores generally fall into two categories: large-format grocery stores, and smaller convenience stores. Spar also offers a collection of DIY of home improvement retail destinations. There are 2,523 outlets in Southern Africa serviced by 9 distribution centers. Gross retail margins during the last fiscal year were 10.8%, and operating margins amounted to 2.1%. The Ireland market is stronger with a 3.1% operating margin. Unfortunately, Ireland accounts for only 20% of group sales. The Irish market hosts 1,161 stores serviced by 25 distribution centers.
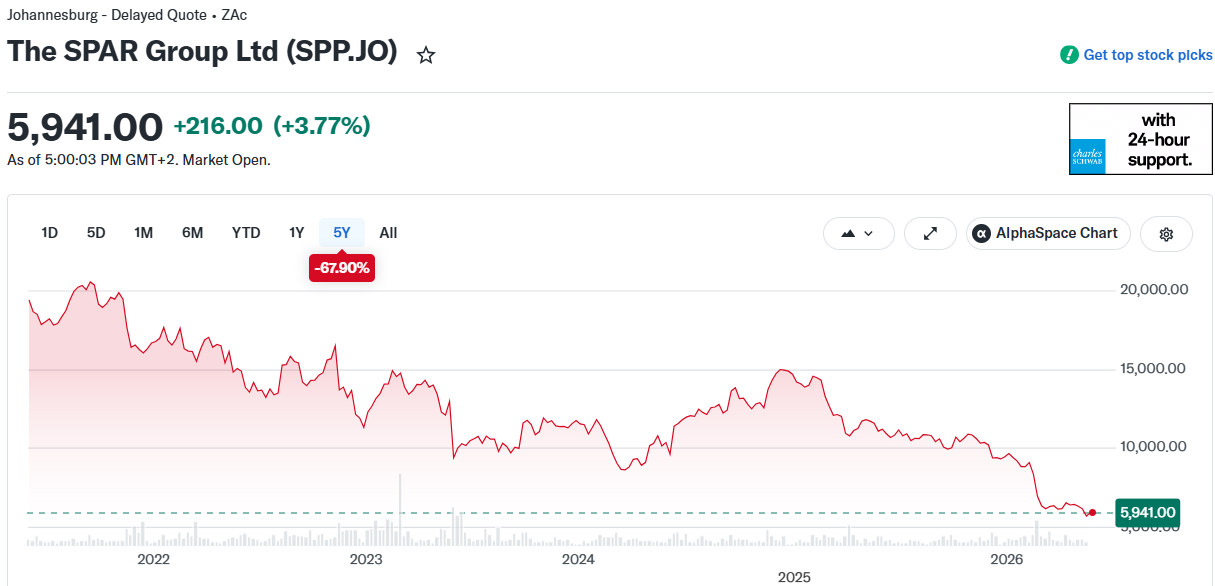
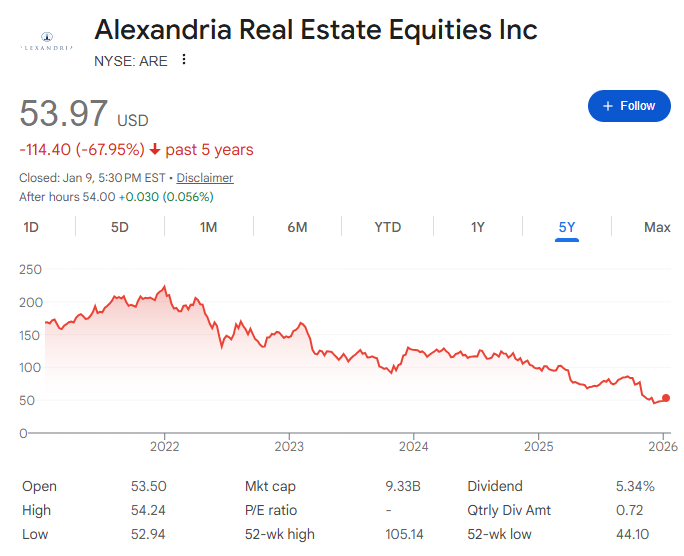
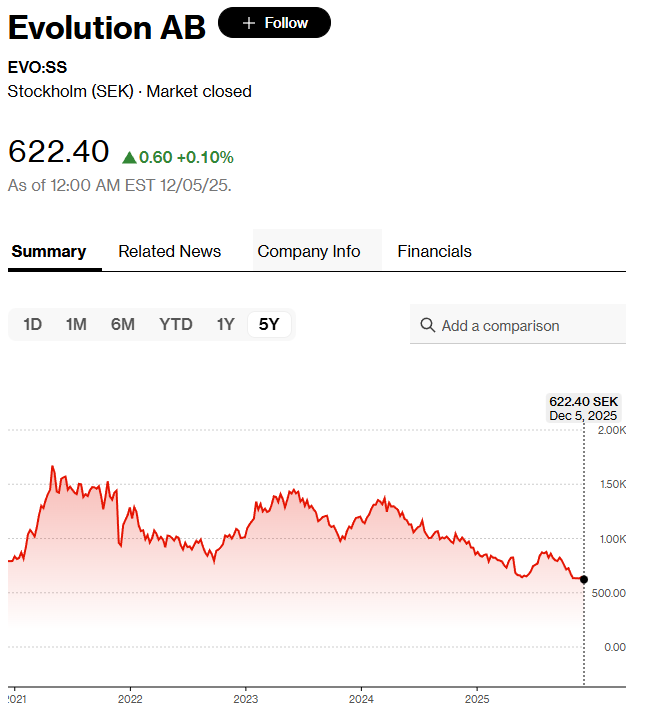
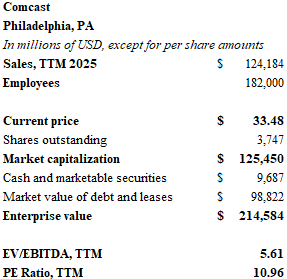
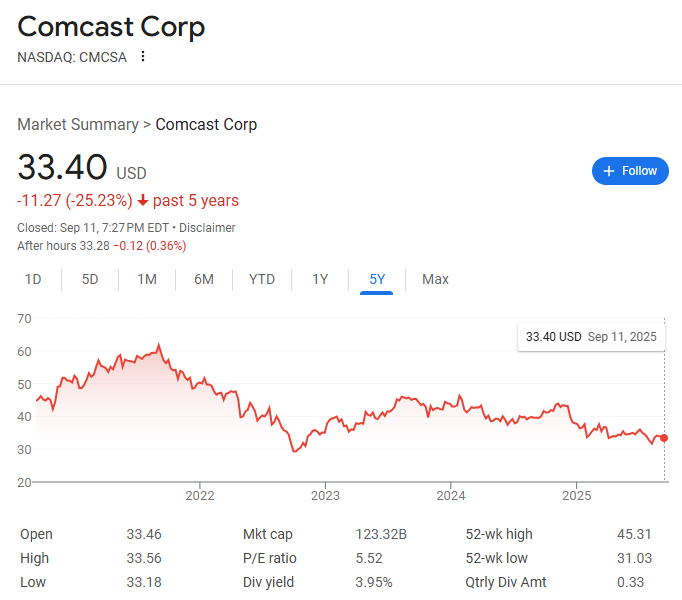
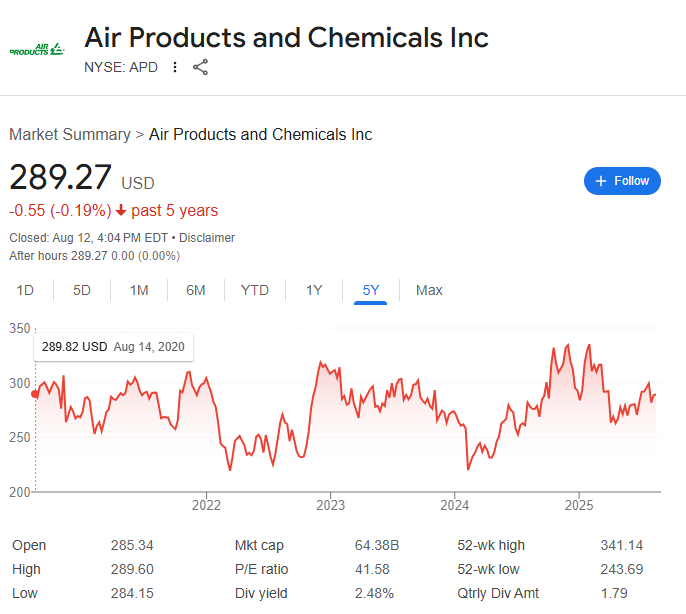
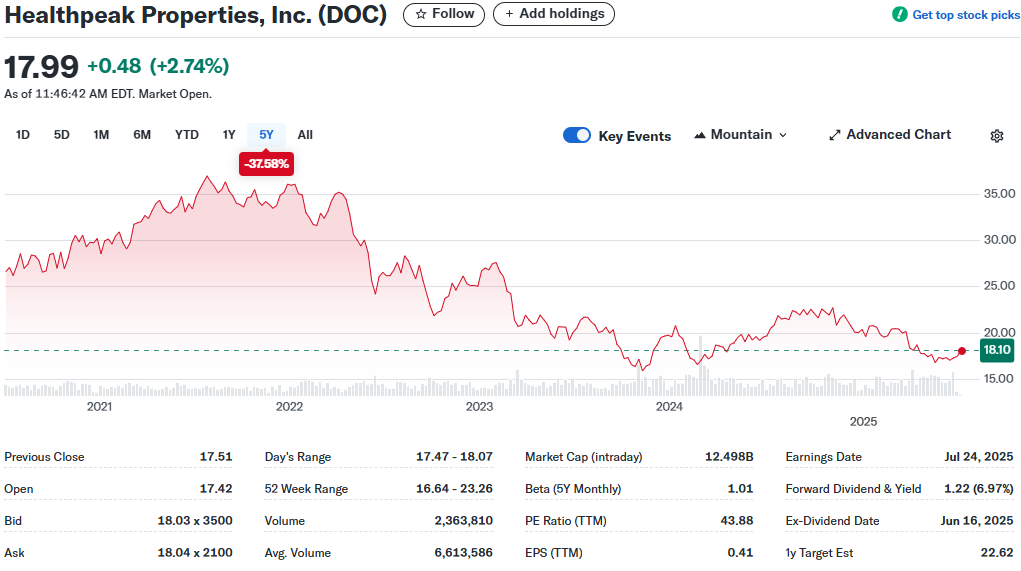
Shares of Spar could be purchased last week on the Johannesburg bourse for 57.25 rand, or about $3.50 per share. The chart is abysmal – down nearly 70% since the Covid peak. The price represents a multiple of 5 times EBITDA and about 13.5 times FY 2025 earnings.
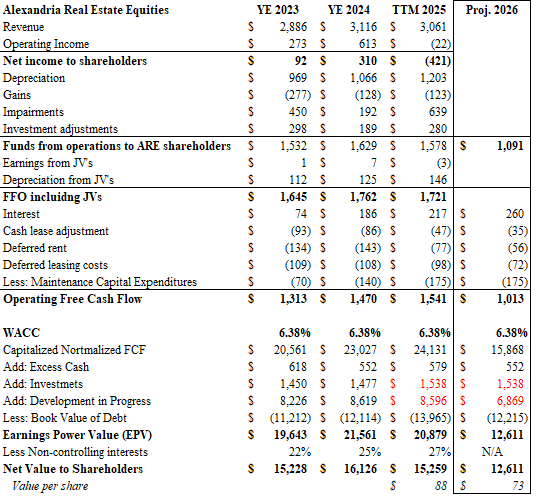
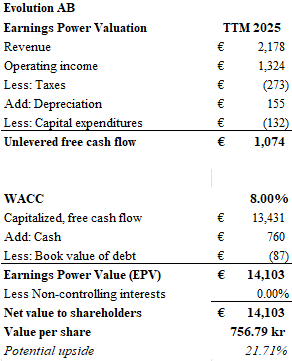
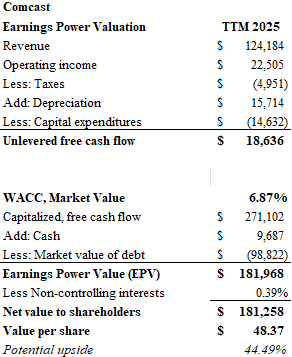
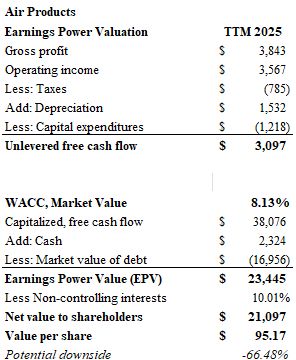
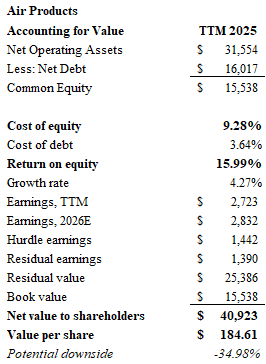
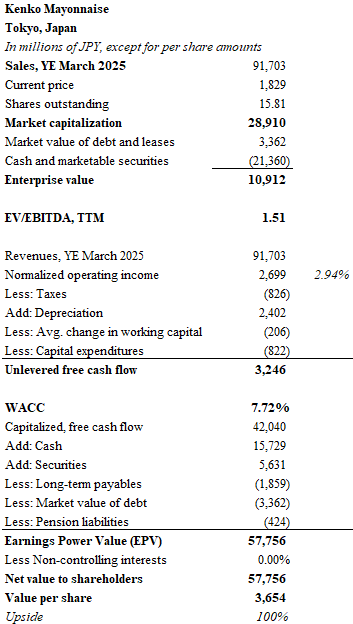
To calculate the intrinsic value of the business, I used the earnings power value (EPV) method favored by Bruce Greenwald and his value investment acolytes. This method takes unlevered free cash flow and divdes it by a weighted average cost of capital to arrive at a gross value of the business. Adjustments are made for cash and debt on the balance sheet to arrive at a net value, or “intrinsic value”.
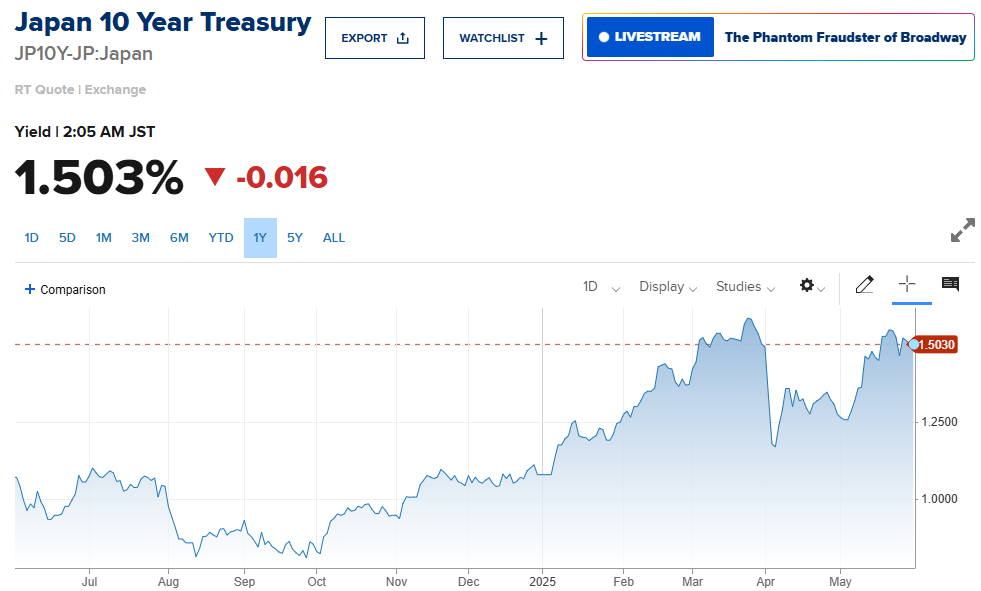
My calculation uses 13% as a weighted average cost of capital. Spar’s 50% debt load, including leases, carries an approximate cost of 9.8%, or 7.15% adjusted for tax deductibility. Equity, the other 50%, bears a cost of 19%. This factor takes the sum of the equity risk premium of about 10.6% on top of the country’s 10-year note yield of 8.5%. I probably could have reduced the rate to account for the 20% of sales from Ireland, but I didn’t bother. 13% seems like a reasonable discount rate.

At 13%, unlevered free cash flow of 2.7 billion rand capitalizes to 21 billion rand. Deducting net debt results in a valuation of 12.6 billion rand, or 65.30 rand per share, or roughly 14% above its recent closing price. I prefer investment candidates with a 30% margin of safety, so Spar doesn’t pass muster.
I also compared Spar with its grocery peers. The gallery included the Canadian grocer Metro, the UK’s Tesco, Kroger, and Spar’s leading competitor Shoprite. Numbers were adjusted to US dollar terms in the accompanying chart. Metro is the most profitable of the group, while Kroger and Tesco show operating margins of 3 and 4 percent, respectively. Spar trails the sector.
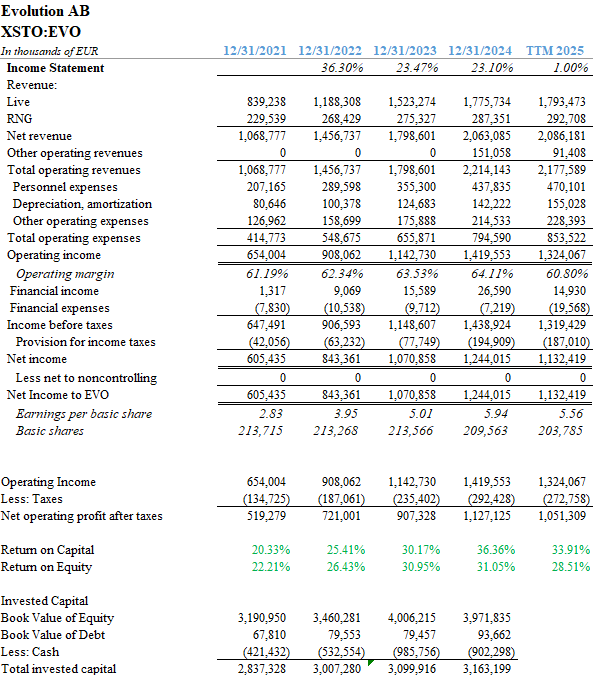
Spar’s gross revenue margin exceeds 12.2% when you include revenue from operator contracts. The operating margin last year was the meager 2% mentioned above. Returns on equity are lackluster at just slightly above 10%. Meanwhile, Shoprite trades with an 8.5 EBITDA multiple and posted a 27% return on equity last year. Spar needs to aim for this target if it hopes to improve shareholder value.

Despite the divestments and improved balance sheet, Spar continues to face challenges. Rising gold and mineral prices have boosted the South African economy, but GDP growth is mired in the low single digits. An inventory management software upgrade has been a fiasco. Early in 2026, CEO Angelo Swartz resigned after three years in the role and 19 years with the company. CFO Reeza Isaacs has stepped into the vacancy. Spar will post first half FY 2026 trading results on June 10, and I expect the numbers will be underwhelming.
Although my calculations indicate that Spar is trading below intrinsic value, the stock is a pass for me. Yes, they can fix the software problems and improve management, but that won’t change the fundamental problem that Chris Hohn so clearly identifies: Spar has no ability to meaningfully lift prices. It is a price-taker, not a price-setter.

A bigger hurdle is the risk that independent operators become disenchanted with the Spar model and abandon the mother ship. Revenue from customer contracts amounted to 2.1 billion rand in FY 2026, or nearly 80% of operating income. Cyncially, one could argue that Spar makes virtually no money at all on the wholesaling business and is completely dependent upon the loyalty payments from independent operators to eke out its modest profits.
Store count is barely growing in Ireland and static or falling in South Africa. Recently, WalMart announced that it would enter the South Africa market. Although the Bentonville behemoth has had its own share of foreign misadventures, many independent operators won’t be able to withstand the siege. We haven’t even mentioned Amazon.
Grocery is a tough business in the best of times. Buffett lost $400 million in Tesco during 2014. Even if I could buy shares of Kroger or Metro at meaningful discounts, I still wouldn’t do it.
Like a good Bloodhound, the search continues. Until next time.
DISCLAIMER
The information provided in this article is based on the opinions of the author after reviewing publicly available press reports and SEC filings. The author makes no representations or warranties as to accuracy of the content provided. This is not investment advice. You should perform your own due diligence before making any investments.